How I Built a Secure Monitoring Dashboard with Grafana on a $5 VPS – Full Indie Dev Guide
As an indie developer based in China and exploring the global indie hacking scene, one of my first projects in 2026 was setting up a fully secure Grafana monitoring dashboard on a budget VPS – all for less than $5 per month. No expensive SaaS tools, no privacy compromises, and full professional polish.
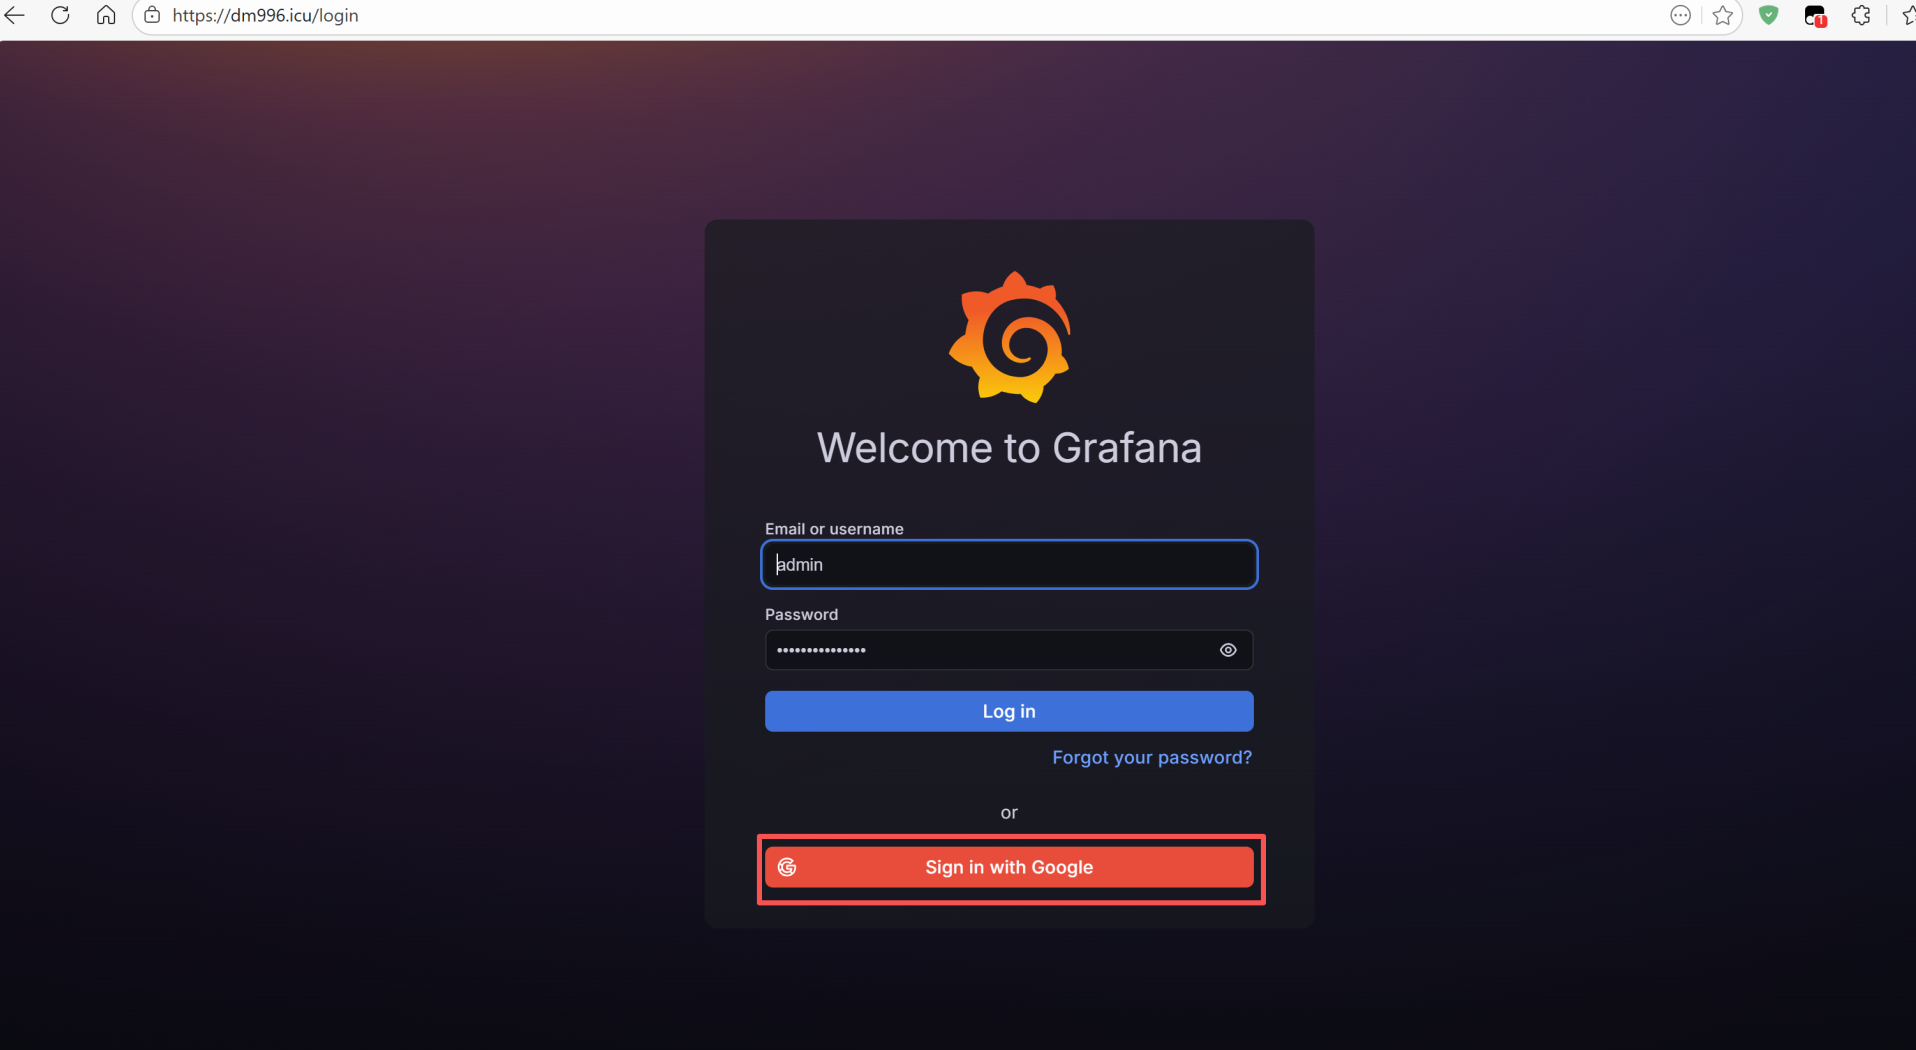
This post is a complete, step-by-step guide based on my real deployment. Everything is production-ready: custom domain, free HTTPS, Google one-click login with built-in MFA, and Nginx reverse proxy.
Why I Built This
- Ultra-low cost:
VPS (~$9.9/year) + domain (~$2–10/year, very cheap) - Complete control:
All data stays on my own server - Professional appearance:
Clean domain instead of raw IP:3000 - Strong security:
Google SSO + MFA, no exposed default credentials
Tools & Costs
- VPS: Racknerd low-cost plan (~$9.9/year)
- Domain: dm996.icu (annual cost ~$2–10, very affordable)
- Grafana OSS (free, latest v12.x)
- Nginx (free)
- Let’s Encrypt certificate (free, auto-renew)
- Google OAuth2 (free)
Complete Step-by-Step Deployment
Step 1: Install Grafana from Official Repository
1 | sudo apt install -y apt-transport-https software-properties-common wget |
Initial test access: http://VPS_IP:3000 → Default: admin / admin (change password on first login).
Step 2: Domain Setup & Free HTTPS with Let’s Encrypt
Purchase domain and set A record to VPS public IP.
Open ports 80 & 443:
1
2
3
sudo ufw allow 80/tcp
sudo ufw allow 443/tcp
sudo ufw reloadInstall Nginx and Certbot:
1
2
3
4
sudo apt install nginx -y
sudo snap install core; sudo snap refresh core
sudo snap install --classic certbot
sudo ln -s /snap/bin/certbot /usr/bin/certbotObtain certificate:
1
sudo certbot --nginx -d dm996.icu
Choose option 2 (redirect HTTP to HTTPS).
Step 3: Configure Nginx Reverse Proxy
Create site config:
1 | sudo nano /etc/nginx/sites-available/grafana |
Full configuration:
1 | server { |
Enable and restart:
1 | sudo ln -s /etc/nginx/sites-available/grafana /etc/nginx/sites-enabled/ |
Step 4: Configure Grafana for Domain & Security
1 | sudo nano /etc/grafana/grafana.ini |
Modify [server] section:
1 | [server] |
Restart Grafana:
1 | sudo systemctl restart grafana-server |
Step 5: Set Up Google OAuth2 SSO with MFA
Google Cloud Console → APIs & Services → Credentials → Create OAuth Client ID
- Application type: Web application
- Authorized redirect URI:
https://dm996.icu/login/google
Add to Grafana config:
1
sudo nano /etc/grafana/grafana.ini
Add section:
1 | [auth.google] |
Restart:
1 | sudo systemctl restart grafana-server |
Step 6: Final Security Hardening (Recommended)
1 | [auth] |
Final Result & Lessons Learned
- Total setup time: ~2 hours
- Running cost: <$10 in the first year (VPS + domain)
- Uptime: Zero downtime so far
- Access URL: https://dm996.icu
- Privacy & Security: Full control with Google-level authentication
This project became the foundation of my indie dev journey and eventually inspired me to launch this blog to document more self-hosted experiments.